Using satellite surface temperature data to monitor urban heat island
(1) Centennial High School, (2) NASA Goddard Space Flight Center
https://doi.org/10.59720/24-342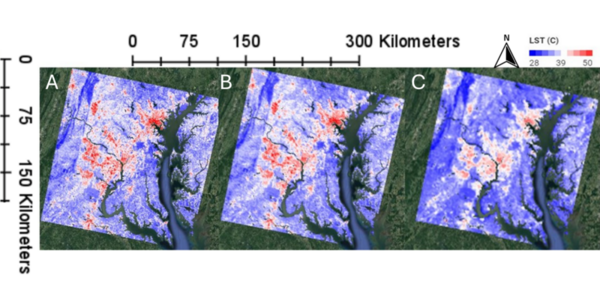
Exposure to heat is a growing concern nationwide. Temperatures can be elevated in cities compared to surrounding rural areas, referred to as an “urban heat island” (UHI) effect, which is intensified during heat waves. The lack of dense networks of air temperature measurements results in few studies on urban heat. Now, a vast amount of high spatial and temporal satellite data on land surface temperature is available. We identified satellite datasets with the longest surface temperature records but different spatial and temporal resolutions: Landsat (1985-current, biweekly at 60 m and 100 m spatial resolution) and the Moderate Resolution Imaging Spectroradiometer (MODIS) data from the Terra and Aqua satellites (2000-current, daily at 1 km spatial resolution). We investigated how satellites with different spatial and temporal resolutions detect UHI effects differently. We hypothesized that 1) a dataset’s spatial resolution impacts the precision of detected UHIs spatially, since high spatial resolution Landsat data better captures spatial variability in temperature, and 2) daily surface temperature data can detect temporal patterns of UHIs and heatwave frequencies. We analyzed Landsat and MODIS satellite data in the Washington, D.C. and Baltimore region. We found that Landsat describes higher spatial variability of the UHI effect than MODIS data. However, MODIS data shows more consistent seasonal surface temperature patterns than Landsat when compared to in situ air temperature measurements. MODIS data was also able to consistently measure the frequency of heat waves. This study demonstrates the value of NASA satellite data for urban heat and climate change studies.
This article has been tagged with: