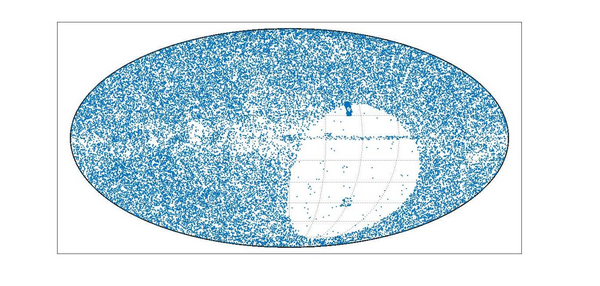
The cosmic microwave background (CMB) is faint electromagnetic radiation left over from early stages in the formation of the universe. In order to analyze the CMB, scientists need to remove from electromagnetic data foreground radiation that contaminates CMB datasets. In this study, students utilize extensive updated datasets to analyze the correlation between CMB maps and Faraday RM and WMAP sky maps.
Have you ever wondered what contributes to the popping ability of popcorn? In this study, the authors use Quantitative Trait Locus (QTL) mapping to identify genes that may contribute to specific popping characteristics including kernel size and popping expansion volume (PEV).
There is limited evidence that extended exposure to an electromagnetic field (EMF) has negative health effects on humans. The authors measured the power density and strength of EMF at different distances and directions in front of a microwave oven, and they discuss the safety of different distances.
Cancer is often caused by improper function of a few proteins, and sometimes it takes only a few proteins to malfunction to cause drastic changes in cells. Here the authors look at the genes that were mutated in patients with a type of pancreatic cancer to identify proteins that are important in causing cancer. They also determined which proteins currently lack effective treatment, and suggest that certain proteins (named KRAS, CDKN2A, and RBBP8) are the most important candidates for developing drugs to treat pancreatic cancer.
To address whether odor sensory circuits are organized topographically, the authors investigate whether the neuronal responses to similar odors amongst different mice mapped similarly in brain.
Most people put little thought into the type of plastic wrap they use to store their leftovers. This study investigates the differences between biodegradable plastic wrap and non-biodegradable plastic wrap in their ability to prevent food spoilage. Does one work better than the other? Read more to find out!
Auto-Regressive Integrated Moving Average (ARIMA) models are known for their influence and application on time series data. This statistical analysis model uses time series data to depict future trends or values: a key contributor to crime mapping algorithms. However, the models may not function to their true potential when analyzing data with many different patterns. In order to determine the potential of ARIMA models, our research will test the model on irregularities in the data. Our team hypothesizes that the ARIMA model will be able to adapt to the different irregularities in the data that do not correspond to a certain trend or pattern. Using crime theft data and an ARIMA model, we determined the results of the ARIMA model’s forecast and how the accuracy differed on different days with irregularities in crime.
In this article, the authors use datasets of professional and youth soccer players' movements to map and statistically compare them. Analysis compared movements that led to goals or no-goals and differences between pros and youth.
Here the authors used morphological characters and DNA barcoding to identify arthropods found within a residential house. With this method they identified their species and compared them against pests lists provided by the US government. They found that none of their identified species were considered to be pests providing evidence against the misconception that arthropods found at home are harmful to humans. They suggest that these methods could be used at larger scales to better understand and aid in mapping ecosystems.
With climate change and rising sea levels, south Brooklyn is exposed to massive flooding and intense precipitation. Previous research discovered that flooding shifts plant species distribution, decreases soil pH, and increases salt concentration, nitrogen, phosphorus, and potassium levels. The authors predicted a decreasing trend from Zone 1 to 6: high-pH, high-salt, and high-nutrients in more flood-prone areas to low-pH, low-salt, and low-nutrient in less flood-prone regions. They performed DNA barcoding to identify plant species inhabiting flood zones with expectations of decreasing salt tolerance and moisture uptake by plants' soil from Zones 1-6. Furthermore, they predicted an increase in invasive species, ultimately resulting in a decrease in biodiversity. After barcoding, they researched existing information regarding invasiveness, ideal soil, pH tolerance, and salt tolerance. They performed soil analyses to identify pH, nitrogen (N), phosphorus (P), and potassium (K) levels. For N and P levels, we discovered a general decreasing trend from Zone 1 to 6 with low and moderate statistical significance respectively. Previous studies found that soil moisture can increase N and P uptake, helping plants adopt efficient resource-use strategies and reduce water stress from flooding. Although characteristics of plants were distributed throughout all zones, demonstrating overall diversity, the soil analyses hinted at the possibility of a rising trend of plants adapting to the increase in flooding. Future expansive research is needed to comprehensively map these trends. Ultimately, investigating trends between flood zones and the prevalence of different species will assist in guiding solutions to weathering climate change and protecting biodiversity in Brooklyn.